First off, super excited to find some folks that actually know what they're talking about with Melda plugs. I've had access to a buddy's system for the past couple weeks, and have taken the opportunity to dig into the Meldaverse. Seriously considering picking up the whole bundle as it's pretty mind-bending stuff.
That being said, I've got some questions that have popped up as I've been digging in. Hopefully I can actually finally find some answers.
I"m taking a more visual mixing/mastering approach very seriously, but it requires very accurate tools. One of those tools I've tried out recently is MAnalyzer, and I love it, but I"m a bit confused trying to get the most accurate results.
First, using Super-Resolution-Mode pretty much always bends the display at around 5-6k where everything below that begins sloping down. This is quite clear even on test signals like pink noise. It seems to essentially distort everything I put into it. My guess based on how consistent the distortion is across all types of input is that the FFT's are being done differently above vs below that point, and somehow not compensated for in the tilt at lower frequencies, though that's just a guess.
Is there some other combination of settings that must be enabled to properly take advantage of SRM, or is it simply always skewed in this way vs any other mode?
Second, if I can't rely on SRM, I'd like to find other settings to optimize for level per frequency accuracy of infinite average on short clips (3-10 seconds). I thought at first that simply increasing FFT size and window size would be more accurate at the expense of CPU, but this appears not to be the case as the low frequencies may go UP with one jump in FFT size, then back DOWN with the next jump. This would not be the case if there was a progression TOWARD accuracy with each increase.
I understand it's an interconnected set of compromises, but I'd appreciate any help fining some sort of optimal balance. I'm less concerned with CPU, and more concerned with making sure I can trust what I see. Judging the top and bottom octaves are half of what got me doing analysis in the first place.
Hopefully, that much is straight forward with some sensible settings. What may be a bit more complex is that I'm wondering if there's then also some way to better approximate human hearing in short term (3-10 second) average static graphs that may contain elements like 808's that are very loud, but short and infrequent as average graphs will minimize them, and peak graphs will over emphasize them.
If it's true that our hearing is more like a very short term (200ms?) average, it's not really feasible to test 200ms clips since, in the case of the 808's, it would either dominate the clip, or not be there at all yielding very different results. So basically , I need to test a minimum of 1 bar at a time, but would like to know if there is some compromise that best represents human hearing in terms of our perception of loud/short vs long/soft sounds within a single static graph. (peak/average hybrid?)
I see peak-average, but it occurs to me that the answer to this might be more like peak+average. Is there any way to dial something like that in? (understanding, of course, that it's accuracy would depend upon the length of the clip).
MAnalyzer settings to optimize for short clip average accuracy
-
- KVRer
- 16 posts since 29 Oct, 2016
That’s a great question Annabanna. Unfortunately I don’t think what you’re looking for exists. I’ve been wishing for something similar for some time.
For measuring the subjective impression of loudness on a whole track there’s only one set of tools I know that exists. That’s the EBU R128 based analyzers. MLoudnessAnalyzer is an example. And for measuring overall perceived loudness these do a *decent* job though I think there’s room for improvement in terms of measuring the subjective loudness of music (the EBU R128 guidelines were developed for loudness normalization in broadcasting and were not designed specifically with music in mind).
To measure subjective loudness EBU R128 uses a combination of pre-filter (basically a high pass filter and a high-shelf—see the picture below) and a gate.
Now if we want to look at the subjective loudness of an entire spectrum, I don’t think there are any tools that allow for this. We could place a filter before the analyzer. This is the K-weighting filter used in the EBU R128:

But there’s no way to apply the gate. So, if I’m analyzing different instruments in a multitrack arrangement with MMultiAnalyzer at a long-term analysis setting of 5000ms say, the kick drum track will appear at a low level because it’s a momentary noise compared to the rhythm guitar track. It’s averaging out the long term sound of the kick included the silent periods between kicks. That’s why a gate is crucial to getting a subjective loudness measurement—especially in relation to more steady-state instruments.
So here’s what I’d love for Vojtech (or some other developer) to make: a spectrum analysis plug-in that uses something similar to EBU R128 (a subjective loudness pre-filter and a gate) but applies the measurements to each bin of an FFT. Wouldn't that be relatively easy to implement? I think it would be way more useful than any of the currently existing analysis tools for comparing infinite averages of tracks in terms of subjective loudness.
For measuring the subjective impression of loudness on a whole track there’s only one set of tools I know that exists. That’s the EBU R128 based analyzers. MLoudnessAnalyzer is an example. And for measuring overall perceived loudness these do a *decent* job though I think there’s room for improvement in terms of measuring the subjective loudness of music (the EBU R128 guidelines were developed for loudness normalization in broadcasting and were not designed specifically with music in mind).
To measure subjective loudness EBU R128 uses a combination of pre-filter (basically a high pass filter and a high-shelf—see the picture below) and a gate.
Now if we want to look at the subjective loudness of an entire spectrum, I don’t think there are any tools that allow for this. We could place a filter before the analyzer. This is the K-weighting filter used in the EBU R128:
But there’s no way to apply the gate. So, if I’m analyzing different instruments in a multitrack arrangement with MMultiAnalyzer at a long-term analysis setting of 5000ms say, the kick drum track will appear at a low level because it’s a momentary noise compared to the rhythm guitar track. It’s averaging out the long term sound of the kick included the silent periods between kicks. That’s why a gate is crucial to getting a subjective loudness measurement—especially in relation to more steady-state instruments.
So here’s what I’d love for Vojtech (or some other developer) to make: a spectrum analysis plug-in that uses something similar to EBU R128 (a subjective loudness pre-filter and a gate) but applies the measurements to each bin of an FFT. Wouldn't that be relatively easy to implement? I think it would be way more useful than any of the currently existing analysis tools for comparing infinite averages of tracks in terms of subjective loudness.
-
- KVRist
- Topic Starter
- 452 posts since 21 Jul, 2018
I realize that last bit is a much tougher nut to crack, but a simpler solution may be at least useful if not ideal. Take the most basic case of an ME shooting for a straight forward 4dB/octave slope. The question then becomes, of course, which measurements are used to determine whether the goal is achieved? It is on the one hand, a very technical question, but on the other a very practical one where the better the graph, the better he can decide if something needs to be pushed up or down.
So, in that sense, it doesn't need to be the perfect solution to be better than his previous solution. In this case, for instance, I am generally looking at short clips (1-4 bars). As such the Infinite average seems most appropriate, though there is still some bias toward longer held sounds vs (in my example) a big 808 that happens only once. However, I also have the infinite peak graph which can tell me whether that momentary peak was higher than other momentary peaks.
While it's hardly the holy grail of clarity, I can see that if the average graph looks flat on that 4dB/octave slope, yet the peak graph shows a 6dB spike in the sub region, I have a pretty good idea what's going on, and though I may not have the perfect interpretation, a basic one would be that if I aim to hit the target curve from the perspective of human hearing (equal loudness per frequency adjustments aside), then I need to turn down the 808's. I don't know EXACTLY how much it needs to be turned down, but I have the general idea that it should be somewhere between flat on the average, and flat on the peak graphs.
That's why I was thinking even something like peak + average, though not ideal would provide a basic understanding, and again, though not perfect, some blending between the two depending on the length of the clip could still give a better indication than either in isolation.
Of course, that still leaves lots of room for improvement, and that's where all the research into various loudness standards, gating, and so on might come into play. The equal loudness curve issues (ISO 226-2003 issues could then be separately addressed if wanted via prefiltering so as not to confuse the issue.
Seems like this is actually a pretty big and often overlooked problem, though, as nearly every ME I've met in the past decade is working toward some shape in at least a general sens, yet looking at miscalibrated tools to do so... at least from a human hearing perspective.
That being said, the other parts of the question should hopefully be easier to answer. It does not purely appear to be the case that increasing FFT size/overlapping improves accuracy. Is there a particular setting there that might be considered better than others for specific reasons? (again, goal being accuracy of loudness per frequency for 1-4 bar clips.)
Also, am I missing something, or is Super Resolution Mode essentially unusable due to the pronounced bend and downward slope to the left around 5-6k? It's so consistent that I've actually considered just fixing the bend via prefiltering, though I don't feel comfortable doing so in a quest for accuracy.
-
- KVRAF
- 3477 posts since 27 Dec, 2002 from North East England
Apologies if I'm underestimating your level of knowledge here, but FFT size is a time-frequency trade-off. Higher FFT sizes offer higher frequency resolution, but poorer time resolution. So if you were looking to check out amplitude structures as well as frequency structure, e.g. a super-fast hi-hat pattern and want to see the amplitudes bouncing up and down on every 'hit', you'd go for a lower FFT size.Annabanna wrote:Second, if I can't rely on SRM, I'd like to find other settings to optimize for level per frequency accuracy of infinite average on short clips (3-10 seconds). I thought at first that simply increasing FFT size and window size would be more accurate at the expense of CPU, but this appears not to be the case as the low frequencies may go UP with one jump in FFT size, then back DOWN with the next jump. This would not be the case if there was a progression TOWARD accuracy with each increase.
The trade-off appears particularly pronounced in the lower frequencies because FFT bins are spaced linearly, whereas we perceive pitch logarithmically (i.e. you double the hertz value every time you go up an octave). As such, a melody played down in the bass range would be spread over fewer bins (i.e. FFT 'points') than the same melody played a few octaves up. The FFT would find it more difficult to track.
One possibility re inconsistent amplitudes in the lower frequencies as you move across FFT sizes is that, if the pitch of the particular frequency you're looking at is well 'aligned' with the size of the FFT, more energy will appear in the correct bins rather than being 'spread' across the correct bin and the bins near it. If the amplitude changes you're seeing involve higher maximums in some bins, but lower minimums in the bins either side, that might be what's happening. That's one way in which the lower frequencies can trick you in a spectrograph - the absolute peaks are higher, but taken as a whole with the frequencies immediately surrounding each peak, the overall energy is the same.
-
- KVRist
- Topic Starter
- 452 posts since 21 Jul, 2018
The information is all appreciated.
I'm learning quickly, but it's all fairly new to me.
I suspected something similar in regards to low frequencies being "aligned" with the FFT size. It's the only explanation I could come up with for NOT seeing a consistent progression in a given direction.
Not looking to be a full time wonk on the details, but also not satisfied with default settings if I can do better... especially as my hearing deteriorates, and I adopt a more visually oriented workflow.
I get in at least a general sense the tradeoff between time and frequency accuracy. From that perspective, I really don't care at all about the time accuracy. Again, if I optimize for any one thing, it's frequency accuracy for an infinite average over a 1-4 bar phrase. I may also look at the peak graph, but the infinite average is more highly weighted (at least until I can get some sort of hybrid graph as discussed.)
That being said, I'm not looking to spend the next month diving into FFT size vs frequency, etc, so was hoping someone with deeper knowledge on the subject might have some guidance.
Are there particular FFT sizes that tend to be problematic in terms of emphasizing or deemphasizing certain frequencies, or is it possible to increase the FFT size to the point where the issues are effectively tuned to be below the human hearing range?
Basically looking for some sensible settings to stick with so I can get familiar with how all my references look, and just dig in from there. One thing I really haven't figured out at all is any sort of optimal relationship between the FFT size and the overlap, and whether issues arise with certain ratios between the two.
-
- KVRAF
- 3477 posts since 27 Dec, 2002 from North East England
If you aren't interested in time resolution at all, say you're just looking for average frequency balance over a longish section (i.e. a few seconds or more) of your track, whack up the FFT sizes as much as you like! MAnalyzer lets you go up to crazy values, but practically speaking, 16384 samples should be plenty (assuming your DAW is running at 44.1 or 48kHz or thereabouts - double the FFT size if you're running at 96kHz to get equivalent frequency resolution). Most plug-ins that utilise FFT in some form tend to have either 8192 or 16384 as the maximum selectable option. Test it out on a sustained chord played in the bass end and see if the peaks down there look thin enough for you.
With regard to overlap, I'm afraid I'm not sure if throwing more and more overlap at things improves accuracy more and more, or if it eventually becomes actively harmful (on top of the usual diminishing returns). I'll leave that one for someone more knowledgeable than me. 8x is a good level I know to be safe. Arguably 4x is absolutely fine for analysis (as opposed to FFT based pitchshifting and the like, for which 4x is usually fine anyway to be honest), but might as well go with 8x if you've the CPU to spare.
With regard to overlap, I'm afraid I'm not sure if throwing more and more overlap at things improves accuracy more and more, or if it eventually becomes actively harmful (on top of the usual diminishing returns). I'll leave that one for someone more knowledgeable than me. 8x is a good level I know to be safe. Arguably 4x is absolutely fine for analysis (as opposed to FFT based pitchshifting and the like, for which 4x is usually fine anyway to be honest), but might as well go with 8x if you've the CPU to spare.
Last edited by cron on Sun Jul 22, 2018 4:59 am, edited 1 time in total.
-
- KVRist
- Topic Starter
- 452 posts since 21 Jul, 2018
Thx.
I've been going with 16x and 16k in the meantime (44.1k). I'm relatively confident that the increased FFT is helping low end accuracy, and that I could go higher, though not really sure at what point tuning issues are essentially past a point of diminishing returns for the bottom octave. I was using pink noise to test, but it's wonky on the low end. I'l take another look with sine sweeps.
I'm much less sure about the overlapping. Can't say I've really noticed much of anything consistent there between 4x and MUCH higher settings... other than my CPU setting off the fire alarm, that is.
Is the Super Resolution Mode bend I mentioned a well known issue here? No one seemed to know what I was talking about on GS, and I've still never heard an explanation. Actually, this whole quest started because I was trying to figure out why SRM was always skewed. (clear bend of roughly 1dB/octave or so positive slope below 5-6k or so.)
-
- KVRAF
- 3477 posts since 27 Dec, 2002 from North East England
Wojtech (the Melda Production developer) is super-active and responsive to queries, so he'll likely answer this himself pretty quickly.
Having said that though, I'm actually not getting the issue you are with SRM. Have you perhaps accidentally left deharmonisation at a non-0% value? That's the only way I can reproduce it. Doesn't seem to play well with the multi-FFT approach of SRM.
For what it's worth though, if time-accuracy is of no interest, you don't need SRM anyway. All it does (AFAIK) is run several FFTs simultaneously, sliding from poor-time/high-freq accuracy at the bass end toward high-time/poor-freq accuracy at the treble end.
-
- KVRist
- Topic Starter
- 452 posts since 21 Jul, 2018
Nope. Derez is at zero, though I may be missing some other setting since I've screwed with them so much.. I've been using a friend's system for the past couple weeks while he's out of the country, and he's got the full suite. Looks like it may be out of date though (He's still got 32 bit plugs running on here). It's hard to read on his tiny screen without my glasses, but it looks like it says version 10.8.
I'm seeing a pretty consistent trend:
Pink noise with SRM disengaged:
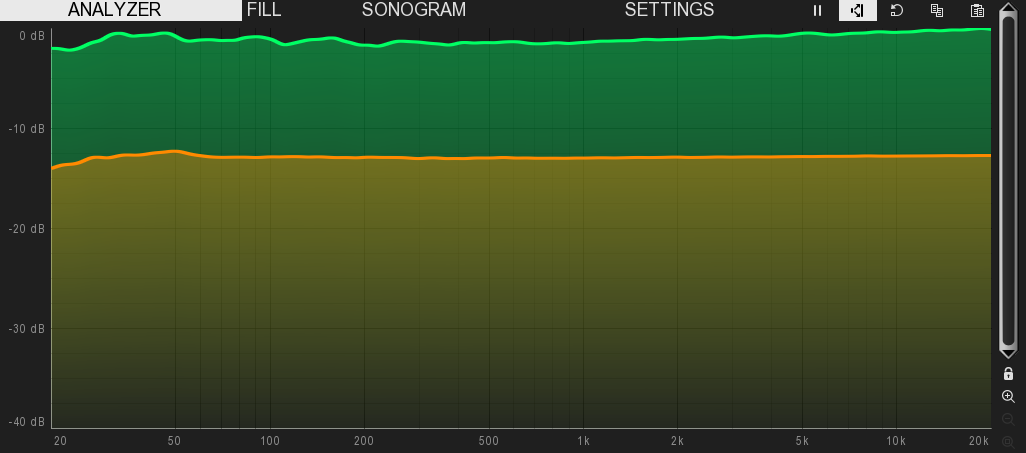
Pink noise with SRM engaged:
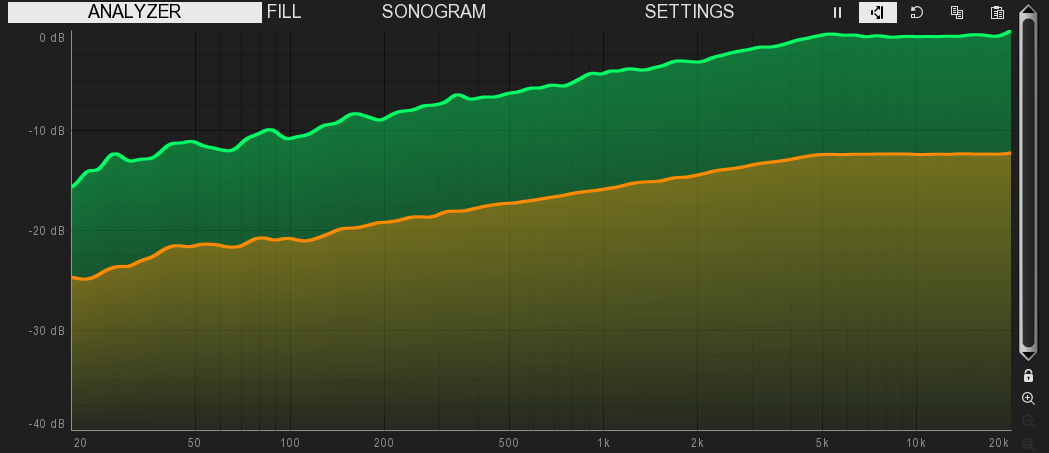
I'm seeing this bend on any signal that goes through SRM, but if you're not seeing something similar on your machine, I'll dig through to see if maybe some other setting is conflicting.
I could be wrong, but I was thinking that perhaps even thought I don't need the time accuracy at the full end that SRM might be providing high accuracy on the low end without the full CPU hit it would incur if the whole spectrum were running at that FFT size.
Forgot to ask earlier: I"m a bit perplexed by something in the manual. It says analytical smoothing is more accurate, but then says it's usually best to leave it OFF for music production. I can't tell if that's intended to imply that it's more technically accurate, but that having it off is a better approximation of our hearing, or it it's more accurate both analytically and in terms of our hearing... but it's CPU consumption may interfere with a heavy DAW session.
I'm seeing a pretty consistent trend:
Pink noise with SRM disengaged:
Pink noise with SRM engaged:
I'm seeing this bend on any signal that goes through SRM, but if you're not seeing something similar on your machine, I'll dig through to see if maybe some other setting is conflicting.
I could be wrong, but I was thinking that perhaps even thought I don't need the time accuracy at the full end that SRM might be providing high accuracy on the low end without the full CPU hit it would incur if the whole spectrum were running at that FFT size.
Forgot to ask earlier: I"m a bit perplexed by something in the manual. It says analytical smoothing is more accurate, but then says it's usually best to leave it OFF for music production. I can't tell if that's intended to imply that it's more technically accurate, but that having it off is a better approximation of our hearing, or it it's more accurate both analytically and in terms of our hearing... but it's CPU consumption may interfere with a heavy DAW session.
-
- KVRAF
- 3477 posts since 27 Dec, 2002 from North East England
Oh, that is interesting. Hopefully Wojtech can shed some light on that one.
I'd assume SRM would always take more CPU as it'll be computing multiple FFTs and constructing the display from those results. I don't think it's possible to compute 'half an FFT spectrum' if you know what I mean. I think it's always an all-or-nothing thing.
Your guess is as good as mine with the analytical smoothing I'm afraid! Another one for Wojtech.
Off to bed here, anyway. Happy FFTing, and welcome to the board!
-
- KVRist
- Topic Starter
- 452 posts since 21 Jul, 2018
If SRM istn't ideal in my case, then I guess it doesn't matter to me, but I am still digging into / wondering about:
1) Analytic smoothing: Is it closer to our hearing or not?
2) Logarithmic smoothig: At first, I thought this was just a scaling issue, but after running many clips through it, it does appear to alter the shape, as well as generally increasing the slope slightly (rougly 0.5dB on the dance music clips I checked).
3) Any overlap issues... perhaps overlap as a function of window size issues, ratios to use/avoid, etc.
4) If there is a specific point at which increasing the FFT size essentially brings any frequencies highlighted by that window size down below the range of human hearing.
-
 MeldaProduction MeldaProduction https://www.kvraudio.com/forum/memberlist.php?mode=viewprofile&u=176122
 - KVRAF
- 14019 posts since 15 Mar, 2008 from Czech republic
Again I didn't read much, but SRM is NOT intended for scientific calculations. While it generally works well, sometimes it can just give you some incorrect "light" when dealing with noise signals typically. The way it works, it combines many FFTs of various sampling rates and needs to produce a usable image. That's unfortunately harder than it looks and the main sideeffect is the little slope "degradation" usually above the 5kHz (depending on SR). For musical signals it doesn't really matter, because you want to find what is in the signal, not really analyzing the details, but for scientific stuff it is better to keep this off.
As for smoothing - the scientific smoothing has been introduced later because the classic smoothing was behaving "confusingly" for analytical signals, typically sinusoids. To give you at least something, imagine specturm without smoothing at all, there are many ways to average it if you look at a certain frequency - you may want to find maximum from its level and surroundings, or you may average it, or you may average it logarithmically, or a combination... And every single case will fail for some specific signal. So the default is an algorithm that works well for musical signals. And the scientific option works nicely for separate sinusoids.
As for smoothing - the scientific smoothing has been introduced later because the classic smoothing was behaving "confusingly" for analytical signals, typically sinusoids. To give you at least something, imagine specturm without smoothing at all, there are many ways to average it if you look at a certain frequency - you may want to find maximum from its level and surroundings, or you may average it, or you may average it logarithmically, or a combination...
-
- KVRist
- Topic Starter
- 452 posts since 21 Jul, 2018
Good info about SRM, thx.
Maybe I'm trying to be too technical. I'm really just looking to find some settings and move on.
Let me just ask in a more common sense way:
What are sensible settings to judge spectral balance for infinite average over short 1-4 bar clips?
When I say "accuracy", I mean from the perspective of human hearing, so, for instance, the graph with or without analytical smoothing may both be "accurate" in a sense, but I'm asking which one best reflects the way we perceive sound. When I say "judge spectral balance", I'm talking specifically about using the readout as a way to determine whether certain frequencies are too high or low vs an idealized curve. When I say "sensible settings", I mean that the CPU isn't too much of a concern (currently doing 16K / 16x without issue, and could likely go higher if useful), and I'm wondering about:
1) Analytical smoothing: On or off for accuracy from the perspective of our hearing?
2) Logarithmic mode: Again, on or off for accuracy from the perspective of human hearing
3) FFT size vs overlap. Using this in a large part to judge sub frequencies, so it's relatively important that it evenly represents down to at least 35 hz.
Since I'm only recently learning about these things, do you have specific recommendations for each of those settings as a starting point?
-
- KVRAF
- 2086 posts since 24 Jun, 2006 from London, England
If you're looking for a super-duper-accurate analyzer check out the free: http://www.jthorborg.com/index.html?ipage=signalizer
https://www.youtube.com/watch?v=JfyausOsFRs
It's sometimes quite fiddly and I mainly use MAnalyzer due to its nice ease of use, but it I need to delve deep the Signalizer helps me out !
https://www.youtube.com/watch?v=JfyausOsFRs
It's sometimes quite fiddly and I mainly use MAnalyzer due to its nice ease of use, but it I need to delve deep the Signalizer helps me out !
-
- KVRist
- Topic Starter
- 452 posts since 21 Jul, 2018
Actually, just downloaded it the other day... though I was only looking at the waveform render options. Wasn't the easiest on the eyes for that task, but maybe it fares better for spectrum analysis.
Same questions arise, though. I'm not faulting MAnalyzer in any way for my confusion at the moment. It's good that it has so many options. I'm just trying to find a roughly optimal set of settings for my purposes.
Same questions arise, though. I'm not faulting MAnalyzer in any way for my confusion at the moment. It's good that it has so many options. I'm just trying to find a roughly optimal set of settings for my purposes.