Log InCreate An Account
  1. Plugins
  2. »
  3. Centre for Digital Music at Queen Mary, University of London
  4. »
  5. Sonic Visualiser
  6. »
  7. Details
Sonic Visualiser
Sonic Visualiser by Centre for Digital Music at Queen Mary, University of London is an Audio Plugin Host for macOS, Windows and Linux. It functions as a LADSPA Plugin. It can host VST Plugins and LADSPA Plugins.
Product
Version
4.0.1
Product
Version
4.0.1
Product
Version
4.0.1
Can Host
Effects
Copy Protection
None
Open Source
GPL
Important Note
Sonic Visualiser cannot support VST plug-ins directly because Steinberg's VST license is incompatible with Sonic Visualiser's GPL license. Windows and OS/X users can get limited support using the Audacity VST Enabler, and Linux users can try dssi-vst.
My KVR - Groups, Versions, & More
56 KVR members have added Sonic Visualiser to 16 My KVR groups 63 times.
Not In Your MY KVR Groups
(or group limitation prevents versioning)
+16 in private groups

KVR Rank

Overall: 8334   6261   7690   498

30-Day: 9231; 7-Day: 4343; Yesterday: 1516

Sonic Visualiser is an application for viewing and analysing the contents of music audio files. The aim of Sonic Visualiser is to be the first program you reach for when want to study a musical recording rather than simply listen to it.

As well as a number of features designed to make exploring audio data as revealing as possible, Sonic Visualiser also has powerful annotation capabilities to help describe what you find, and the ability to run automated annotation and analysis plugins.

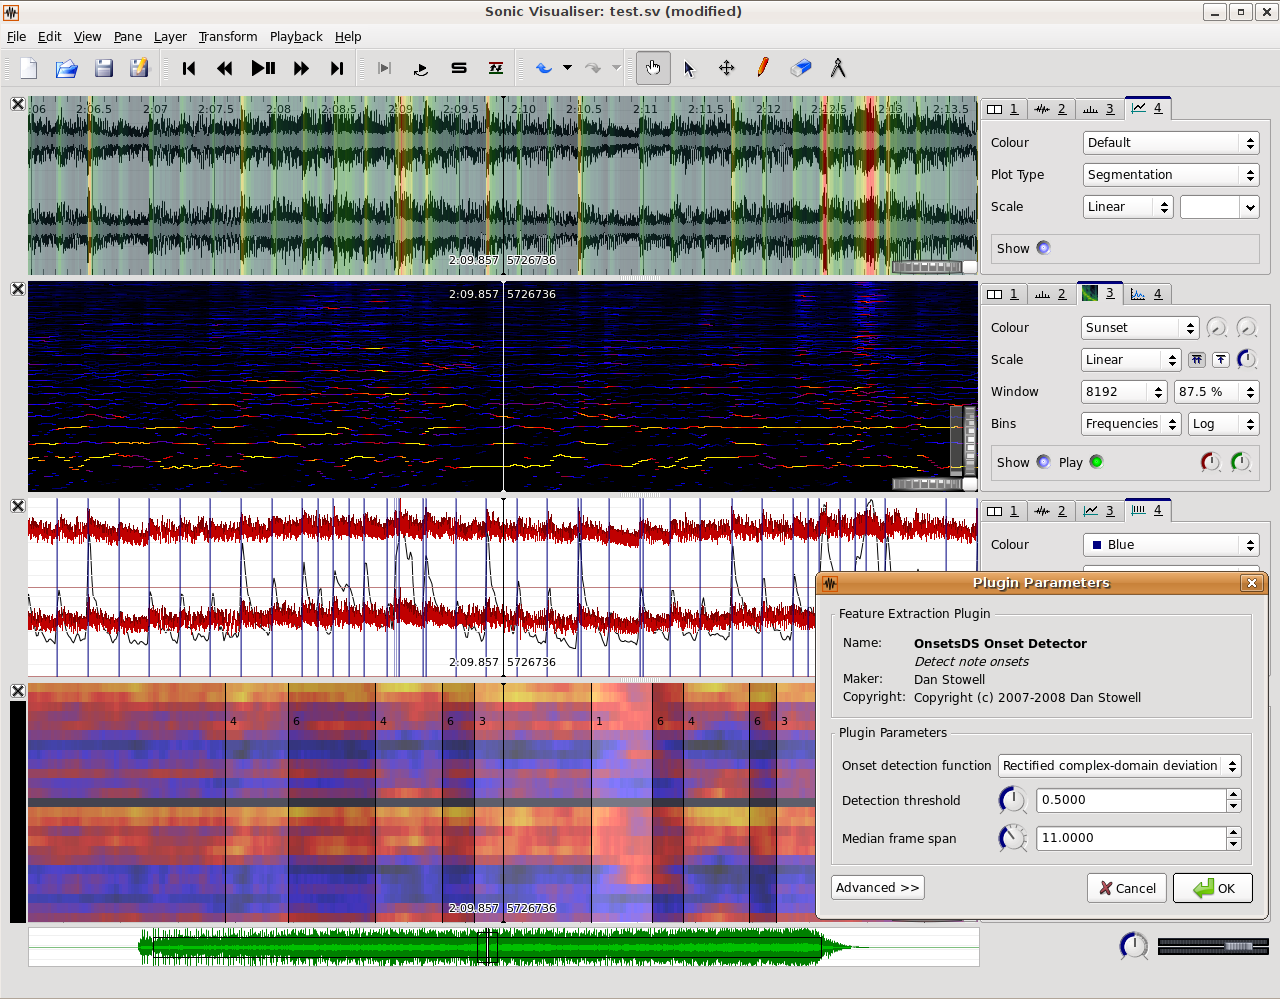
Features include sophisticated spectrogram views; multi-resolution waveform and data displays; manual annotation of time points and curves; measurement capabilities from spectrogram and spectrum; playback at any speed; looping and playback of discontiguous selections; ability to apply standard audio effects and compare the results with their inputs; and support for onset detection, beat tracking, structural segmentation, key estimation and many other automated feature extraction algorithms via Vamp audio analysis plugins.

Sonic Visualiser contains features for the following:

  • Load audio files in WAV, Ogg and MP3 formats, and view their waveforms.
  • Look at audio visualisations such as spectrogram views, with interactive adjustment of display parameters.
  • Annotate audio data by adding labelled time points and defining segments, point values and curves.
  • Overlay annotations on top of one another with aligned scales, and overlay annotations on top of waveform or spectrogram views.
  • View the same data at multiple time resolutions simultaneously (for close-up and overview).
  • Run feature-extraction plugins to calculate annotations automatically, using algorithms such as beat trackers, pitch detectors and so on.
  • Import annotation layers from various text file formats.
  • Import note data from MIDI files, view it alongside other frequency scales, and play it with the original audio.
  • Play back the audio plus synthesised annotations, taking care to synchronise playback with display.
  • Select areas of interest, optionally snapping to nearby feature locations, and audition individual and comparative selections in seamless loops.
  • Time-stretch playback, slowing right down or speeding up to a tiny fraction or huge multiple of the original speed while retaining a synchronised display.
  • Export audio regions and annotation layers to external files.

The design goals for Sonic Visualiser are:

  • To provide the best available core waveform and spectrogram audio visualisations for use with substantial files of music audio data.
  • To facilitate ready comparisons between different kinds of data, for example by making it easy to overlay one set of data on another, or display the same data in more than one way at the same time.
  • To be straightforward. The user interface should be simpler to learn and to explain than the internal data structures. In this respect, Sonic Visualiser aims to resemble a consumer audio application.
  • To be responsive, slick, and enjoyable. Even if you have to wait for your results to be calculated, you should be able to do something else with the audio data while you wait. Sonic Visualiser is pervasively multithreaded, loves multiprocessor and multicore systems, and can make good use of fast processors with plenty of memory.
  • To handle large data sets. The work Sonic Visualiser does is intrinsically processor-hungry and (often) memory-hungry, but the aim is to allow you to work with long audio files on machines with modest CPU and memory where reasonable. (Disk space is another matter. Sonic Visualiser eats that.).

Latest User Reviews

Average user rating of 0.00 from 0 reviews

Comments & Discussion for Centre for Digital Music at Queen Mary, University of London Sonic Visualiser

Discussion
Discussion: Active

Please log in to join the discussion