Intercept the random distribution used by a plugin

DSP, Plugin and Host development discussion.
Post Reply New Topic
RELATED
PRODUCTS

Post

Hi there,

maybe the question could looks a bit weird, but whats in your opinion a correct (and concrete) way to intercept which kind of distribution a plugin will use internally randomize its params? (such hitting its own Random button).

I mean, gaussian, uniform, and so on.

From decompiling there are some routine to catch easily?
Quite sure its made by C++ and probably JUCE (VST).

Its random results sound very "musical", so i'd like to understand the starting point (uniform random on mine plugin, with the same param scaling, its "bad" compared with it).

Any suggestions or tips?
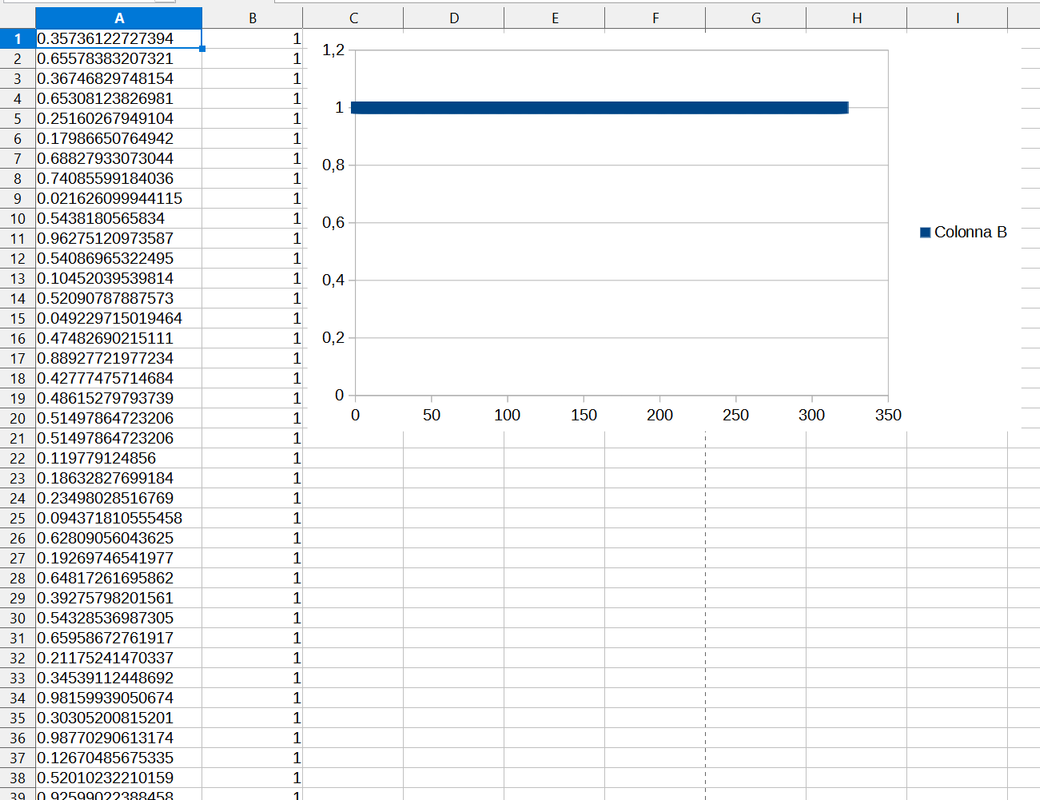
I've also thing to map a param to gain on a DC signal, execute 1billion random hit, sample the result and made a graph (maybe with some Reaper script), but thats of course a huge work :)

Post

Measure from the outside, then analyse statistically.
We are the KVR collective. Resistance is futile. You will be assimilated. Image
My MusicCalc is served over https!!

Post

BertKoor wrote: Sun Mar 26, 2023 11:16 am Measure from the outside, then analyse statistically.
Let say I collect a list of 1k samples: how/where would you plot them to show the distribution graph?

Post

With Excel? Or write a little program yourself for that task...
We are the KVR collective. Resistance is futile. You will be assimilated. Image
My MusicCalc is served over https!!

Post

BertKoor wrote: Mon Mar 27, 2023 2:40 pm With Excel? Or write a little program yourself for that task...
Tried with LibreOffice, with a basic list of 320 values:

Code: Select all

0.35736122727394
0.65578383207321
0.36746829748154
0.65308123826981
0.25160267949104
0.17986650764942
0.68827933073044
0.74085599184036
0.021626099944115
0.5438180565834
0.96275120973587
0.54086965322495
0.10452039539814
0.52090787887573
0.049229715019464
0.47482690215111
0.88927721977234
0.42777475714684
0.48615279793739
0.51497864723206
0.51497864723206
0.119779124856
0.18632827699184
0.23498028516769
0.094371810555458
0.62809056043625
0.19269746541977
0.64817261695862
0.39275798201561
0.54328536987305
0.65958672761917
0.21175241470337
0.34539112448692
0.98159939050674
0.30305200815201
0.98770290613174
0.12670485675335
0.52010232210159
0.92599022388458
0.60289293527603
0.46733790636063
0.38384726643562
0.71888643503189
0.62669199705124
0.058092199265957
0.20921711623669
0.57957011461258
0.98038959503174
0.70569682121277
0.78569376468658
0.83948826789856
0.81253927946091
0.45087888836861
0.2044188529253
0.88154298067093
0.9430964589119
0.79799741506577
0.062698647379875
0.916708111763
0.36653932929039
0.686792075634
0.57516169548035
0.84192007780075
0.45398929715157
0.1506778895855
0.73886758089066
0.73886758089066
0.5842205286026
0.90376180410385
0.43313521146774
0.78366851806641
0.61555582284927
0.35896778106689
0.99540388584137
0.53105068206787
0.63434457778931
0.093074142932892
0.55678999423981
0.58316421508789
0.50490188598633
0.61616438627243
0.41598585247993
0.39554351568222
0.94064766168594
0.28558483719826
0.55104428529739
0.75701057910919
0.64395982027054
0.52741771936417
0.77082818746567
0.34144642949104
0.47240820527077
0.55560553073883
0.76629239320755
0.21964646875858
0.0014037343207747
0.18251113593578
0.7008820772171
0.26459807157516
0.676114320755
0.57029956579208
0.79131704568863
0.56762224435806
0.68556761741638
0.40197461843491
0.60936260223389
0.45140463113785
0.10952690243721
0.73250567913055
0.91877865791321
0.64264667034149
0.65997189283371
0.69569146633148
0.22703078389168
0.20364570617676
0.10543701797724
0.72579610347748
0.74669903516769
0.048450864851475
0.88528800010681
0.14224815368652
0.63562917709351
0.24334481358528
0.41509994864464
0.93164765834808
0.61714249849319
0.84940415620804
0.59211772680283
0.6379103064537
0.91209936141968
0.17105023562908
0.23542848229408
0.18567562103271
0.77396088838577
0.87120085954666
0.85868984460831
0.66430294513702
0.37749853730202
0.2713802754879
0.75938045978546
0.99319994449615
0.83338272571564
0.12256927788258
0.91855329275131
0.58031904697418
0.28707176446915
0.3864443898201
0.4055772125721
0.63398420810699
0.40439122915268
0.86183696985245
0.65557301044464
0.45647478103638
0.68172478675842
0.41075953841209
0.18104058504105
0.18104058504105
0.55180740356445
0.47024995088577
0.74331986904144
0.55701094865799
0.63887673616409
0.036181945353746
0.20053899288177
0.21003785729408
0.046599373221397
0.44819837808609
0.29588451981544
0.99020117521286
0.55515950918198
0.28540337085724
0.33573848009109
0.32237619161606
0.56519109010696
0.68125480413437
0.70966613292694
0.044304307550192
0.75619995594025
0.78837269544601
0.22500289976597
0.73608875274658
0.82130068540573
0.48422667384148
0.53680872917175
0.33585426211357
0.82510673999786
0.79715818166733
0.50166350603104
0.2923067510128
0.56619763374329
0.76544409990311
0.44822430610657
0.11528535932302
0.57893258333206
0.039187092334032
0.52319496870041
0.40421333909035
0.078555971384048
0.67639434337616
0.63075357675552
0.73135524988174
0.93874853849411
0.091963440179825
0.057047601789236
0.8673267364502
0.34532991051674
0.70335173606873
0.75774103403091
0.0113555919379
0.95016711950302
0.33199787139893
0.91252946853638
0.94496101140976
0.46505373716354
0.10825859755278
0.72092187404633
0.39722883701324
0.69909584522247
0.37350735068321
0.36142021417618
0.69056534767151
0.020789263769984
0.65052974224091
0.47264966368675
0.74118608236313
0.28644809126854
0.077481798827648
0.67925578355789
0.29774412512779
0.042013708502054
0.077114522457123
0.3948777616024
0.50914746522903
0.6007325053215
0.40800356864929
0.034732397645712
0.37911006808281
0.70306187868118
0.95506650209427
0.58493906259537
0.76630347967148
0.35888984799385
0.64024472236633
0.25643417239189
0.46672749519348
0.090306304395199
0.039033852517605
0.32805263996124
0.72632133960724
0.77343863248825
0.68335652351379
0.71409833431244
0.69975060224533
0.21107943356037
0.51549768447876
0.81261724233627
0.83419811725616
0.24793866276741
0.57150381803513
0.66588842868805
0.61896616220474
0.91441249847412
0.14624996483326
0.83673626184464
0.32248824834824
0.70297503471375
0.4975870847702
0.94365453720093
0.22329980134964
0.54698580503464
0.54551666975021
0.85304981470108
0.93160980939865
0.49131172895432
0.11673313379288
0.77491688728333
0.95994788408279
0.97725522518158
0.56829535961151
0.20383355021477
0.017160190269351
0.37355905771255
0.23042471706867
0.87331783771515
0.11764712631702
0.086541019380093
0.061890840530396
0.80945587158203
0.58064901828766
0.69464325904846
0.37717890739441
0.66854310035706
0.66854310035706
0.17169709503651
0.94793367385864
0.038297578692436
0.89066916704178
0.72656410932541
0.72656410932541
0.30197224020958
0.69222396612167
0.98970150947571
0.69219380617142
0.66198891401291
0.52884137630463
0.95040768384933
0.12436956912279
0.75415056943893
0.6880869269371
0.49439159035683
0.49439159035683
0.31584060192108
0.99812036752701
0.72946006059647
0.57997304201126
0.57234996557236
0.97262704372406
0.93637955188751
0.20585335791111
0.40732726454735
But its too much "flat", can't catch which kind of distribution it could be:

Image

Post

You didn't plot the samples, but the column of "1"s.

But it's probably not the best way to look at the samples. What you want is a histogram. Here's some python code (needs matplotlib and pandas) to do it (put the above samples in a text file 'smpls.txt'):

Code: Select all

import matplotlib.pyplot as plt
import pandas as pd

df = pd.read_csv('smpls.txt', bins=20)
plt.hist(df)
plt.show()
Here's the result:
Image
https://www.dropbox.com/s/9net79uyoo51v ... o.png?dl=0

(Damn hosting pics for forums on dropbox used to work...)

Doesn't look uniform, but also not very gaussian. Seems centered around 0.7 (sqrt(1/2)?). Could be that the sqrt of a uniform produces something like that.

Post

hugoderwolf wrote: Tue Mar 28, 2023 9:44 am You didn't plot the samples, but the column of "1"s.

But it's probably not the best way to look at the samples. What you want is a histogram. Here's some python code (needs matplotlib and pandas) to do it (put the above samples in a text file 'smpls.txt'):

Code: Select all

import matplotlib.pyplot as plt
import pandas as pd

df = pd.read_csv('smpls.txt', bins=20)
plt.hist(df)
plt.show()
Here's the result:
Image
https://www.dropbox.com/s/9net79uyoo51v ... o.png?dl=0

(Damn hosting pics for forums on dropbox used to work...)

Doesn't look uniform, but also not very gaussian. Seems centered around 0.7 (sqrt(1/2)?). Could be that the sqrt of a uniform produces something like that.
Thanks, it seems to works. I'll do some analysis and report to you later :)

Note: I think the code is:

Code: Select all

df = pd.read_csv('samples.txt')
plt.hist(df, bins=20)
with bins on plt.hist, not pd.read_csv :borg:

Post Reply

Return to “DSP and Plugin Development”