Hello all.
Here I am with a problem, that I have since some windows uptdate at the middle of the last year I think.
While playing in Cubase ore any DAW I have , a vst instrument with some moving grafics or light ors so, sounds starts to crackle and there are CPU peeks anaunced by Waveform at least.
Thats the problem with Cubase, Waveform, Mixcraft and so on.
I have 8 Cores in my mashine.
Intel i7, each 4,0 GHz.
16 GB memory.
In my opinion, this should be enough to play a vst without crackling.
Even Pianoteq suddenly starts causing this and states, lowe CPU power.
???????
Anybody else having this trouble suddenly without having it bevore?
Found the reason.
I checked everything in the soundcard settings that is possible without a change.
Running win 10, latest version and having a Steinberg soundcard.
May be the grafic card interrupts?
-

- KVRAF
- 16802 posts since 8 Mar, 2005 from Utrecht, Holland
What does resplendence LatencyMon say about your system?
Have you researched performance tweaks, especially those dealing with power plans?
Have you researched performance tweaks, especially those dealing with power plans?
We are the KVR collective. Resistance is futile. You will be assimilated. 
My MusicCalc is served over https!!
My MusicCalc is served over https!!
-
qtheerearranger qtheerearranger https://www.kvraudio.com/forum/memberlist.php?mode=viewprofile&u=325452
- KVRian
- 926 posts since 26 Mar, 2014 from Denver, Co
Are you using an audio interface or your computer audio? At least on Mac there are reports of bad cpu when using Mac’s built in audio driver. I know your on windows but it’s a thought. Whenever I have the laptop out of the studio and I’m doing sound design while watching tv or something my cpu overloads way earlier then it would with an audio interface. Why does the audio interface effect cpu when they are unrelated? I don’t know maybe something with asio guard
Bitwig 6 • Diva, Dune, Serum, and UVI Falcon are my Daily Drivers • Drum Machines • Harrison 32c + DSM 3 + American Class A Enjoyer • Apple M4 Max • Apollo User • DJ • Dance Music is life
-

- KVRAF
- 14138 posts since 20 Nov, 2003 from Lost and Spaced
Also check you Power Settings. I think one of the updates had a Power Management 'fix'.
-
- KVRAF
- 9106 posts since 28 Apr, 2013
Windows update is the problem. First, turn that off. Second, Disable Telemetry Compatibility. Third, turn off Defender.
And when you start your DAW, first open Task manager as these two will still try to run under some other trigger and End Task from there. Then give it a couple of minutes and it should go back to something close to normal. If you search these under their names with CPU usage, you'll see they are known issues that MS seemingly has incorporated on purpose. And they've incorporated something to turn them back on so you have to keep an eye on them.
Add/edit: there's also the Anti-malware Service Executable from within Defender that needs to have it's settings changed and where you can add exclusions for your DAW folder and plugin extensions and apparently even for itself. This helps to reduce CPU use too.
Also note that on my system, update has turned off virtual cores and only recognizes physical core now. And there are articles stating they don't believe multithreading is really necessary most of the time and actively tries to keep many things on a single core.
I call all of these things their poison pill market scheme. Trying to convince everyone their machine is just too old and that the user having control is the problem.
-
- KVRAF
- Topic Starter
- 2595 posts since 26 Jul, 2004
Thanks a lot BBFG.
I also read about the point, that Windows changed this multicore useage thing and was powering down powerfull PC´s that way.
Can I change that secret change?
All the best
I also read about the point, that Windows changed this multicore useage thing and was powering down powerfull PC´s that way.
Can I change that secret change?
All the best
-
 mountainmaster mountainmaster https://www.kvraudio.com/forum/memberlist.php?mode=viewprofile&u=153531
 - KVRian
- 621 posts since 10 Jun, 2007 from Netherlands
There may be two different issues here.
Crackle is usually a sign that the latency in the ASIO driver is set too low.
A dedicated graphics card (GPU) does not use CPU. However, a CPU with integrated graphics will share its memory with its graphics chip. You never mentioned which GPU you have.
Crackle is usually a sign that the latency in the ASIO driver is set too low.
A dedicated graphics card (GPU) does not use CPU. However, a CPU with integrated graphics will share its memory with its graphics chip. You never mentioned which GPU you have.
-
- KVRAF
- 1763 posts since 1 Aug, 2006 from Italy
If this started after a driver update, there's a chance that may be the culprit.
As already suggested, start by checking with LatencyMon. This tool will show you if a specific driver is taking too much interrupt time. If it's so, then you can take action, looking for an upgrade (or downgrading to a previous release, if it you know it worked properly in the past), disabling/changing things and so on.
As already suggested, start by checking with LatencyMon. This tool will show you if a specific driver is taking too much interrupt time. If it's so, then you can take action, looking for an upgrade (or downgrading to a previous release, if it you know it worked properly in the past), disabling/changing things and so on.
-
- KVRAF
- Topic Starter
- 2595 posts since 26 Jul, 2004
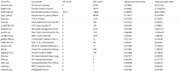
Here are the Latency Mon Data without any software in use:
_________________________________________________________________________________________________________
CONCLUSION
_________________________________________________________________________________________________________
Your system appears to be suitable for handling real-time audio and other tasks without dropouts.
LatencyMon has been analyzing your system for 0:00:19 (h:mm:ss) on all processors.
_________________________________________________________________________________________________________
SYSTEM INFORMATION
_________________________________________________________________________________________________________
Computer name: DESKTOP-DQGK7MF
OS version: Windows 10, 10.0, version 2009, build: 19045 (x64)
Hardware: All Series, ASUS
BIOS: 2201
CPU: GenuineIntel Intel(R) Core(TM) i7-4790K CPU @ 4.00GHz
Logical processors: 8
Processor groups: 1
Processor group size: 8
RAM: 16317 MB total
_________________________________________________________________________________________________________
CPU SPEED
_________________________________________________________________________________________________________
Reported CPU speed (WMI): 4001 MHz
Reported CPU speed (registry): 3991 MHz
Note: reported execution times may be calculated based on a fixed reported CPU speed. Disable variable speed settings like Intel Speed Step and AMD Cool N Quiet in the BIOS setup for more accurate results.
_________________________________________________________________________________________________________
MEASURED INTERRUPT TO USER PROCESS LATENCIES
_________________________________________________________________________________________________________
The interrupt to process latency reflects the measured interval that a usermode process needed to respond to a hardware request from the moment the interrupt service routine started execution. This includes the scheduling and execution of a DPC routine, the signaling of an event and the waking up of a usermode thread from an idle wait state in response to that event.
Highest measured interrupt to process latency (µs): 218,50
Average measured interrupt to process latency (µs): 18,020552
Highest measured interrupt to DPC latency (µs): 188,90
Average measured interrupt to DPC latency (µs): 3,690589
_________________________________________________________________________________________________________
REPORTED ISRs
_________________________________________________________________________________________________________
Interrupt service routines are routines installed by the OS and device drivers that execute in response to a hardware interrupt signal.
Highest ISR routine execution time (µs): 15,047858
Driver with highest ISR routine execution time: Wdf01000.sys - Kernelmodustreiber-Frameworklaufzeit, Microsoft Corporation
Highest reported total ISR routine time (%): 0,001022
Driver with highest ISR total time: Wdf01000.sys - Kernelmodustreiber-Frameworklaufzeit, Microsoft Corporation
Total time spent in ISRs (%) 0,001022
ISR count (execution time <250 µs): 445
ISR count (execution time 250-500 µs): 0
ISR count (execution time 500-1000 µs): 0
ISR count (execution time 1000-2000 µs): 0
ISR count (execution time 2000-4000 µs): 0
ISR count (execution time >=4000 µs): 0
_________________________________________________________________________________________________________
REPORTED DPCs
_________________________________________________________________________________________________________
DPC routines are part of the interrupt servicing dispatch mechanism and disable the possibility for a process to utilize the CPU while it is interrupted until the DPC has finished execution.
Highest DPC routine execution time (µs): 200,621398
Driver with highest DPC routine execution time: dxgkrnl.sys - DirectX Graphics Kernel, Microsoft Corporation
Highest reported total DPC routine time (%): 0,029573
Driver with highest DPC total execution time: rspLLL64.sys - Resplendence Latency Monitoring and Auxiliary Kernel Library, Resplendence Software Projects Sp.
Total time spent in DPCs (%) 0,076022
DPC count (execution time <250 µs): 16935
DPC count (execution time 250-500 µs): 0
DPC count (execution time 500-10000 µs): 0
DPC count (execution time 1000-2000 µs): 0
DPC count (execution time 2000-4000 µs): 0
DPC count (execution time >=4000 µs): 0
_________________________________________________________________________________________________________
REPORTED HARD PAGEFAULTS
_________________________________________________________________________________________________________
Hard pagefaults are events that get triggered by making use of virtual memory that is not resident in RAM but backed by a memory mapped file on disk. The process of resolving the hard pagefault requires reading in the memory from disk while the process is interrupted and blocked from execution.
NOTE: some processes were hit by hard pagefaults. If these were programs producing audio, they are likely to interrupt the audio stream resulting in dropouts, clicks and pops. Check the Processes tab to see which programs were hit.
Process with highest pagefault count: system
Total number of hard pagefaults 3
Hard pagefault count of hardest hit process: 2
Number of processes hit: 2
_________________________________________________________________________________________________________
PER CPU DATA
_________________________________________________________________________________________________________
CPU 0 Interrupt cycle time (s): 0,370157
CPU 0 ISR highest execution time (µs): 15,047858
CPU 0 ISR total execution time (s): 0,001515
CPU 0 ISR count: 426
CPU 0 DPC highest execution time (µs): 200,621398
CPU 0 DPC total execution time (s): 0,104627
CPU 0 DPC count: 16237
_________________________________________________________________________________________________________
CPU 1 Interrupt cycle time (s): 0,149628
CPU 1 ISR highest execution time (µs): 1,561513
CPU 1 ISR total execution time (s): 0,000002
CPU 1 ISR count: 1
CPU 1 DPC highest execution time (µs): 9,799549
CPU 1 DPC total execution time (s): 0,000022
CPU 1 DPC count: 5
_________________________________________________________________________________________________________
CPU 2 Interrupt cycle time (s): 0,160548
CPU 2 ISR highest execution time (µs): 1,178401
CPU 2 ISR total execution time (s): 0,000003
CPU 2 ISR count: 4
CPU 2 DPC highest execution time (µs): 79,939865
CPU 2 DPC total execution time (s): 0,003866
CPU 2 DPC count: 222
_________________________________________________________________________________________________________
CPU 3 Interrupt cycle time (s): 0,174236
CPU 3 ISR highest execution time (µs): 3,613130
CPU 3 ISR total execution time (s): 0,000015
CPU 3 ISR count: 6
CPU 3 DPC highest execution time (µs): 39,283388
CPU 3 DPC total execution time (s): 0,001240
CPU 3 DPC count: 77
_________________________________________________________________________________________________________
CPU 4 Interrupt cycle time (s): 0,153857
CPU 4 ISR highest execution time (µs): 3,900777
CPU 4 ISR total execution time (s): 0,000007
CPU 4 ISR count: 2
CPU 4 DPC highest execution time (µs): 76,807066
CPU 4 DPC total execution time (s): 0,003602
CPU 4 DPC count: 215
_________________________________________________________________________________________________________
CPU 5 Interrupt cycle time (s): 0,172665
CPU 5 ISR highest execution time (µs): 12,872212
CPU 5 ISR total execution time (s): 0,000013
CPU 5 ISR count: 1
CPU 5 DPC highest execution time (µs): 28,183413
CPU 5 DPC total execution time (s): 0,000113
CPU 5 DPC count: 13
_________________________________________________________________________________________________________
CPU 6 Interrupt cycle time (s): 0,157468
CPU 6 ISR highest execution time (µs): 2,017038
CPU 6 ISR total execution time (s): 0,000007
CPU 6 ISR count: 5
CPU 6 DPC highest execution time (µs): 48,649461
CPU 6 DPC total execution time (s): 0,002510
CPU 6 DPC count: 159
_________________________________________________________________________________________________________
CPU 7 Interrupt cycle time (s): 0,182021
CPU 7 ISR highest execution time (µs): 0,0
CPU 7 ISR total execution time (s): 0,0
CPU 7 ISR count: 0
CPU 7 DPC highest execution time (µs): 29,274868
CPU 7 DPC total execution time (s): 0,000048
CPU 7 DPC count: 7
_________________________________________________________________________________________________________
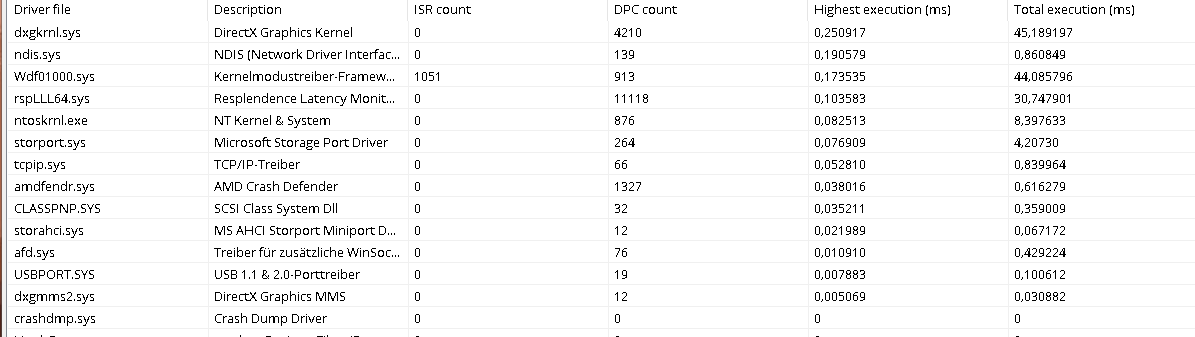
Here is cubase in use an my playing something on the new Serum2:
_________________________________________________________________________________________________________
CONCLUSION
_________________________________________________________________________________________________________
Your system appears to be suitable for handling real-time audio and other tasks without dropouts.
LatencyMon has been analyzing your system for 0:00:39 (h:mm:ss) on all processors.
_________________________________________________________________________________________________________
SYSTEM INFORMATION
_________________________________________________________________________________________________________
Computer name: DESKTOP-DQGK7MF
OS version: Windows 10, 10.0, version 2009, build: 19045 (x64)
Hardware: All Series, ASUS
BIOS: 2201
CPU: GenuineIntel Intel(R) Core(TM) i7-4790K CPU @ 4.00GHz
Logical processors: 8
Processor groups: 1
Processor group size: 8
RAM: 16317 MB total
_________________________________________________________________________________________________________
CPU SPEED
_________________________________________________________________________________________________________
Reported CPU speed (WMI): 4001 MHz
Reported CPU speed (registry): 3991 MHz
Note: reported execution times may be calculated based on a fixed reported CPU speed. Disable variable speed settings like Intel Speed Step and AMD Cool N Quiet in the BIOS setup for more accurate results.
_________________________________________________________________________________________________________
MEASURED INTERRUPT TO USER PROCESS LATENCIES
_________________________________________________________________________________________________________
The interrupt to process latency reflects the measured interval that a usermode process needed to respond to a hardware request from the moment the interrupt service routine started execution. This includes the scheduling and execution of a DPC routine, the signaling of an event and the waking up of a usermode thread from an idle wait state in response to that event.
Highest measured interrupt to process latency (µs): 148,20
Average measured interrupt to process latency (µs): 4,480297
Highest measured interrupt to DPC latency (µs): 144,90
Average measured interrupt to DPC latency (µs): 1,531957
_________________________________________________________________________________________________________
REPORTED ISRs
_________________________________________________________________________________________________________
Interrupt service routines are routines installed by the OS and device drivers that execute in response to a hardware interrupt signal.
Highest ISR routine execution time (µs): 28,770734
Driver with highest ISR routine execution time: Wdf01000.sys - Kernelmodustreiber-Frameworklaufzeit, Microsoft Corporation
Highest reported total ISR routine time (%): 0,003602
Driver with highest ISR total time: Wdf01000.sys - Kernelmodustreiber-Frameworklaufzeit, Microsoft Corporation
Total time spent in ISRs (%) 0,003602
ISR count (execution time <250 µs): 11231
ISR count (execution time 250-500 µs): 0
ISR count (execution time 500-1000 µs): 0
ISR count (execution time 1000-2000 µs): 0
ISR count (execution time 2000-4000 µs): 0
ISR count (execution time >=4000 µs): 0
_________________________________________________________________________________________________________
REPORTED DPCs
_________________________________________________________________________________________________________
DPC routines are part of the interrupt servicing dispatch mechanism and disable the possibility for a process to utilize the CPU while it is interrupted until the DPC has finished execution.
Highest DPC routine execution time (µs): 135,308444
Driver with highest DPC routine execution time: Wdf01000.sys - Kernelmodustreiber-Frameworklaufzeit, Microsoft Corporation
Highest reported total DPC routine time (%): 0,112513
Driver with highest DPC total execution time: Wdf01000.sys - Kernelmodustreiber-Frameworklaufzeit, Microsoft Corporation
Total time spent in DPCs (%) 0,193314
DPC count (execution time <250 µs): 59985
DPC count (execution time 250-500 µs): 0
DPC count (execution time 500-10000 µs): 0
DPC count (execution time 1000-2000 µs): 0
DPC count (execution time 2000-4000 µs): 0
DPC count (execution time >=4000 µs): 0
_________________________________________________________________________________________________________
REPORTED HARD PAGEFAULTS
_________________________________________________________________________________________________________
Hard pagefaults are events that get triggered by making use of virtual memory that is not resident in RAM but backed by a memory mapped file on disk. The process of resolving the hard pagefault requires reading in the memory from disk while the process is interrupted and blocked from execution.
NOTE: some processes were hit by hard pagefaults. If these were programs producing audio, they are likely to interrupt the audio stream resulting in dropouts, clicks and pops. Check the Processes tab to see which programs were hit.
Process with highest pagefault count: gdscan.exe
Total number of hard pagefaults 41
Hard pagefault count of hardest hit process: 27
Number of processes hit: 4
_________________________________________________________________________________________________________
PER CPU DATA
_________________________________________________________________________________________________________
CPU 0 Interrupt cycle time (s): 1,244552
CPU 0 ISR highest execution time (µs): 28,770734
CPU 0 ISR total execution time (s): 0,009782
CPU 0 ISR count: 9094
CPU 0 DPC highest execution time (µs): 135,308444
CPU 0 DPC total execution time (s): 0,576991
CPU 0 DPC count: 55708
_________________________________________________________________________________________________________
CPU 1 Interrupt cycle time (s): 0,215414
CPU 1 ISR highest execution time (µs): 15,284390
CPU 1 ISR total execution time (s): 0,000757
CPU 1 ISR count: 1105
CPU 1 DPC highest execution time (µs): 43,175645
CPU 1 DPC total execution time (s): 0,001284
CPU 1 DPC count: 134
_________________________________________________________________________________________________________
CPU 2 Interrupt cycle time (s): 0,202271
CPU 2 ISR highest execution time (µs): 12,332749
CPU 2 ISR total execution time (s): 0,000087
CPU 2 ISR count: 148
CPU 2 DPC highest execution time (µs): 40,914307
CPU 2 DPC total execution time (s): 0,005267
CPU 2 DPC count: 555
_________________________________________________________________________________________________________
CPU 3 Interrupt cycle time (s): 0,177814
CPU 3 ISR highest execution time (µs): 2,379354
CPU 3 ISR total execution time (s): 0,000079
CPU 3 ISR count: 111
CPU 3 DPC highest execution time (µs): 37,630669
CPU 3 DPC total execution time (s): 0,001068
CPU 3 DPC count: 93
_________________________________________________________________________________________________________
CPU 4 Interrupt cycle time (s): 0,451245
CPU 4 ISR highest execution time (µs): 13,568529
CPU 4 ISR total execution time (s): 0,000224
CPU 4 ISR count: 209
CPU 4 DPC highest execution time (µs): 60,434227
CPU 4 DPC total execution time (s): 0,013741
CPU 4 DPC count: 3007
_________________________________________________________________________________________________________
CPU 5 Interrupt cycle time (s): 0,170372
CPU 5 ISR highest execution time (µs): 13,876221
CPU 5 ISR total execution time (s): 0,000246
CPU 5 ISR count: 470
CPU 5 DPC highest execution time (µs): 28,814332
CPU 5 DPC total execution time (s): 0,000295
CPU 5 DPC count: 37
_________________________________________________________________________________________________________
CPU 6 Interrupt cycle time (s): 0,177238
CPU 6 ISR highest execution time (µs): 8,586570
CPU 6 ISR total execution time (s): 0,000039
CPU 6 ISR count: 52
CPU 6 DPC highest execution time (µs): 46,184665
CPU 6 DPC total execution time (s): 0,003421
CPU 6 DPC count: 305
_________________________________________________________________________________________________________
CPU 7 Interrupt cycle time (s): 0,200464
CPU 7 ISR highest execution time (µs): 1,411175
CPU 7 ISR total execution time (s): 0,000032
CPU 7 ISR count: 42
CPU 7 DPC highest execution time (µs): 54,337760
CPU 7 DPC total execution time (s): 0,001566
CPU 7 DPC count: 146
_________________________________________________________________________________________________________
May be someone can make some sense out of this.
_________________________________________________________________________________________________________
CONCLUSION
_________________________________________________________________________________________________________
Your system appears to be suitable for handling real-time audio and other tasks without dropouts.
LatencyMon has been analyzing your system for 0:00:19 (h:mm:ss) on all processors.
_________________________________________________________________________________________________________
SYSTEM INFORMATION
_________________________________________________________________________________________________________
Computer name: DESKTOP-DQGK7MF
OS version: Windows 10, 10.0, version 2009, build: 19045 (x64)
Hardware: All Series, ASUS
BIOS: 2201
CPU: GenuineIntel Intel(R) Core(TM) i7-4790K CPU @ 4.00GHz
Logical processors: 8
Processor groups: 1
Processor group size: 8
RAM: 16317 MB total
_________________________________________________________________________________________________________
CPU SPEED
_________________________________________________________________________________________________________
Reported CPU speed (WMI): 4001 MHz
Reported CPU speed (registry): 3991 MHz
Note: reported execution times may be calculated based on a fixed reported CPU speed. Disable variable speed settings like Intel Speed Step and AMD Cool N Quiet in the BIOS setup for more accurate results.
_________________________________________________________________________________________________________
MEASURED INTERRUPT TO USER PROCESS LATENCIES
_________________________________________________________________________________________________________
The interrupt to process latency reflects the measured interval that a usermode process needed to respond to a hardware request from the moment the interrupt service routine started execution. This includes the scheduling and execution of a DPC routine, the signaling of an event and the waking up of a usermode thread from an idle wait state in response to that event.
Highest measured interrupt to process latency (µs): 218,50
Average measured interrupt to process latency (µs): 18,020552
Highest measured interrupt to DPC latency (µs): 188,90
Average measured interrupt to DPC latency (µs): 3,690589
_________________________________________________________________________________________________________
REPORTED ISRs
_________________________________________________________________________________________________________
Interrupt service routines are routines installed by the OS and device drivers that execute in response to a hardware interrupt signal.
Highest ISR routine execution time (µs): 15,047858
Driver with highest ISR routine execution time: Wdf01000.sys - Kernelmodustreiber-Frameworklaufzeit, Microsoft Corporation
Highest reported total ISR routine time (%): 0,001022
Driver with highest ISR total time: Wdf01000.sys - Kernelmodustreiber-Frameworklaufzeit, Microsoft Corporation
Total time spent in ISRs (%) 0,001022
ISR count (execution time <250 µs): 445
ISR count (execution time 250-500 µs): 0
ISR count (execution time 500-1000 µs): 0
ISR count (execution time 1000-2000 µs): 0
ISR count (execution time 2000-4000 µs): 0
ISR count (execution time >=4000 µs): 0
_________________________________________________________________________________________________________
REPORTED DPCs
_________________________________________________________________________________________________________
DPC routines are part of the interrupt servicing dispatch mechanism and disable the possibility for a process to utilize the CPU while it is interrupted until the DPC has finished execution.
Highest DPC routine execution time (µs): 200,621398
Driver with highest DPC routine execution time: dxgkrnl.sys - DirectX Graphics Kernel, Microsoft Corporation
Highest reported total DPC routine time (%): 0,029573
Driver with highest DPC total execution time: rspLLL64.sys - Resplendence Latency Monitoring and Auxiliary Kernel Library, Resplendence Software Projects Sp.
Total time spent in DPCs (%) 0,076022
DPC count (execution time <250 µs): 16935
DPC count (execution time 250-500 µs): 0
DPC count (execution time 500-10000 µs): 0
DPC count (execution time 1000-2000 µs): 0
DPC count (execution time 2000-4000 µs): 0
DPC count (execution time >=4000 µs): 0
_________________________________________________________________________________________________________
REPORTED HARD PAGEFAULTS
_________________________________________________________________________________________________________
Hard pagefaults are events that get triggered by making use of virtual memory that is not resident in RAM but backed by a memory mapped file on disk. The process of resolving the hard pagefault requires reading in the memory from disk while the process is interrupted and blocked from execution.
NOTE: some processes were hit by hard pagefaults. If these were programs producing audio, they are likely to interrupt the audio stream resulting in dropouts, clicks and pops. Check the Processes tab to see which programs were hit.
Process with highest pagefault count: system
Total number of hard pagefaults 3
Hard pagefault count of hardest hit process: 2
Number of processes hit: 2
_________________________________________________________________________________________________________
PER CPU DATA
_________________________________________________________________________________________________________
CPU 0 Interrupt cycle time (s): 0,370157
CPU 0 ISR highest execution time (µs): 15,047858
CPU 0 ISR total execution time (s): 0,001515
CPU 0 ISR count: 426
CPU 0 DPC highest execution time (µs): 200,621398
CPU 0 DPC total execution time (s): 0,104627
CPU 0 DPC count: 16237
_________________________________________________________________________________________________________
CPU 1 Interrupt cycle time (s): 0,149628
CPU 1 ISR highest execution time (µs): 1,561513
CPU 1 ISR total execution time (s): 0,000002
CPU 1 ISR count: 1
CPU 1 DPC highest execution time (µs): 9,799549
CPU 1 DPC total execution time (s): 0,000022
CPU 1 DPC count: 5
_________________________________________________________________________________________________________
CPU 2 Interrupt cycle time (s): 0,160548
CPU 2 ISR highest execution time (µs): 1,178401
CPU 2 ISR total execution time (s): 0,000003
CPU 2 ISR count: 4
CPU 2 DPC highest execution time (µs): 79,939865
CPU 2 DPC total execution time (s): 0,003866
CPU 2 DPC count: 222
_________________________________________________________________________________________________________
CPU 3 Interrupt cycle time (s): 0,174236
CPU 3 ISR highest execution time (µs): 3,613130
CPU 3 ISR total execution time (s): 0,000015
CPU 3 ISR count: 6
CPU 3 DPC highest execution time (µs): 39,283388
CPU 3 DPC total execution time (s): 0,001240
CPU 3 DPC count: 77
_________________________________________________________________________________________________________
CPU 4 Interrupt cycle time (s): 0,153857
CPU 4 ISR highest execution time (µs): 3,900777
CPU 4 ISR total execution time (s): 0,000007
CPU 4 ISR count: 2
CPU 4 DPC highest execution time (µs): 76,807066
CPU 4 DPC total execution time (s): 0,003602
CPU 4 DPC count: 215
_________________________________________________________________________________________________________
CPU 5 Interrupt cycle time (s): 0,172665
CPU 5 ISR highest execution time (µs): 12,872212
CPU 5 ISR total execution time (s): 0,000013
CPU 5 ISR count: 1
CPU 5 DPC highest execution time (µs): 28,183413
CPU 5 DPC total execution time (s): 0,000113
CPU 5 DPC count: 13
_________________________________________________________________________________________________________
CPU 6 Interrupt cycle time (s): 0,157468
CPU 6 ISR highest execution time (µs): 2,017038
CPU 6 ISR total execution time (s): 0,000007
CPU 6 ISR count: 5
CPU 6 DPC highest execution time (µs): 48,649461
CPU 6 DPC total execution time (s): 0,002510
CPU 6 DPC count: 159
_________________________________________________________________________________________________________
CPU 7 Interrupt cycle time (s): 0,182021
CPU 7 ISR highest execution time (µs): 0,0
CPU 7 ISR total execution time (s): 0,0
CPU 7 ISR count: 0
CPU 7 DPC highest execution time (µs): 29,274868
CPU 7 DPC total execution time (s): 0,000048
CPU 7 DPC count: 7
_________________________________________________________________________________________________________
Here is cubase in use an my playing something on the new Serum2:
_________________________________________________________________________________________________________
CONCLUSION
_________________________________________________________________________________________________________
Your system appears to be suitable for handling real-time audio and other tasks without dropouts.
LatencyMon has been analyzing your system for 0:00:39 (h:mm:ss) on all processors.
_________________________________________________________________________________________________________
SYSTEM INFORMATION
_________________________________________________________________________________________________________
Computer name: DESKTOP-DQGK7MF
OS version: Windows 10, 10.0, version 2009, build: 19045 (x64)
Hardware: All Series, ASUS
BIOS: 2201
CPU: GenuineIntel Intel(R) Core(TM) i7-4790K CPU @ 4.00GHz
Logical processors: 8
Processor groups: 1
Processor group size: 8
RAM: 16317 MB total
_________________________________________________________________________________________________________
CPU SPEED
_________________________________________________________________________________________________________
Reported CPU speed (WMI): 4001 MHz
Reported CPU speed (registry): 3991 MHz
Note: reported execution times may be calculated based on a fixed reported CPU speed. Disable variable speed settings like Intel Speed Step and AMD Cool N Quiet in the BIOS setup for more accurate results.
_________________________________________________________________________________________________________
MEASURED INTERRUPT TO USER PROCESS LATENCIES
_________________________________________________________________________________________________________
The interrupt to process latency reflects the measured interval that a usermode process needed to respond to a hardware request from the moment the interrupt service routine started execution. This includes the scheduling and execution of a DPC routine, the signaling of an event and the waking up of a usermode thread from an idle wait state in response to that event.
Highest measured interrupt to process latency (µs): 148,20
Average measured interrupt to process latency (µs): 4,480297
Highest measured interrupt to DPC latency (µs): 144,90
Average measured interrupt to DPC latency (µs): 1,531957
_________________________________________________________________________________________________________
REPORTED ISRs
_________________________________________________________________________________________________________
Interrupt service routines are routines installed by the OS and device drivers that execute in response to a hardware interrupt signal.
Highest ISR routine execution time (µs): 28,770734
Driver with highest ISR routine execution time: Wdf01000.sys - Kernelmodustreiber-Frameworklaufzeit, Microsoft Corporation
Highest reported total ISR routine time (%): 0,003602
Driver with highest ISR total time: Wdf01000.sys - Kernelmodustreiber-Frameworklaufzeit, Microsoft Corporation
Total time spent in ISRs (%) 0,003602
ISR count (execution time <250 µs): 11231
ISR count (execution time 250-500 µs): 0
ISR count (execution time 500-1000 µs): 0
ISR count (execution time 1000-2000 µs): 0
ISR count (execution time 2000-4000 µs): 0
ISR count (execution time >=4000 µs): 0
_________________________________________________________________________________________________________
REPORTED DPCs
_________________________________________________________________________________________________________
DPC routines are part of the interrupt servicing dispatch mechanism and disable the possibility for a process to utilize the CPU while it is interrupted until the DPC has finished execution.
Highest DPC routine execution time (µs): 135,308444
Driver with highest DPC routine execution time: Wdf01000.sys - Kernelmodustreiber-Frameworklaufzeit, Microsoft Corporation
Highest reported total DPC routine time (%): 0,112513
Driver with highest DPC total execution time: Wdf01000.sys - Kernelmodustreiber-Frameworklaufzeit, Microsoft Corporation
Total time spent in DPCs (%) 0,193314
DPC count (execution time <250 µs): 59985
DPC count (execution time 250-500 µs): 0
DPC count (execution time 500-10000 µs): 0
DPC count (execution time 1000-2000 µs): 0
DPC count (execution time 2000-4000 µs): 0
DPC count (execution time >=4000 µs): 0
_________________________________________________________________________________________________________
REPORTED HARD PAGEFAULTS
_________________________________________________________________________________________________________
Hard pagefaults are events that get triggered by making use of virtual memory that is not resident in RAM but backed by a memory mapped file on disk. The process of resolving the hard pagefault requires reading in the memory from disk while the process is interrupted and blocked from execution.
NOTE: some processes were hit by hard pagefaults. If these were programs producing audio, they are likely to interrupt the audio stream resulting in dropouts, clicks and pops. Check the Processes tab to see which programs were hit.
Process with highest pagefault count: gdscan.exe
Total number of hard pagefaults 41
Hard pagefault count of hardest hit process: 27
Number of processes hit: 4
_________________________________________________________________________________________________________
PER CPU DATA
_________________________________________________________________________________________________________
CPU 0 Interrupt cycle time (s): 1,244552
CPU 0 ISR highest execution time (µs): 28,770734
CPU 0 ISR total execution time (s): 0,009782
CPU 0 ISR count: 9094
CPU 0 DPC highest execution time (µs): 135,308444
CPU 0 DPC total execution time (s): 0,576991
CPU 0 DPC count: 55708
_________________________________________________________________________________________________________
CPU 1 Interrupt cycle time (s): 0,215414
CPU 1 ISR highest execution time (µs): 15,284390
CPU 1 ISR total execution time (s): 0,000757
CPU 1 ISR count: 1105
CPU 1 DPC highest execution time (µs): 43,175645
CPU 1 DPC total execution time (s): 0,001284
CPU 1 DPC count: 134
_________________________________________________________________________________________________________
CPU 2 Interrupt cycle time (s): 0,202271
CPU 2 ISR highest execution time (µs): 12,332749
CPU 2 ISR total execution time (s): 0,000087
CPU 2 ISR count: 148
CPU 2 DPC highest execution time (µs): 40,914307
CPU 2 DPC total execution time (s): 0,005267
CPU 2 DPC count: 555
_________________________________________________________________________________________________________
CPU 3 Interrupt cycle time (s): 0,177814
CPU 3 ISR highest execution time (µs): 2,379354
CPU 3 ISR total execution time (s): 0,000079
CPU 3 ISR count: 111
CPU 3 DPC highest execution time (µs): 37,630669
CPU 3 DPC total execution time (s): 0,001068
CPU 3 DPC count: 93
_________________________________________________________________________________________________________
CPU 4 Interrupt cycle time (s): 0,451245
CPU 4 ISR highest execution time (µs): 13,568529
CPU 4 ISR total execution time (s): 0,000224
CPU 4 ISR count: 209
CPU 4 DPC highest execution time (µs): 60,434227
CPU 4 DPC total execution time (s): 0,013741
CPU 4 DPC count: 3007
_________________________________________________________________________________________________________
CPU 5 Interrupt cycle time (s): 0,170372
CPU 5 ISR highest execution time (µs): 13,876221
CPU 5 ISR total execution time (s): 0,000246
CPU 5 ISR count: 470
CPU 5 DPC highest execution time (µs): 28,814332
CPU 5 DPC total execution time (s): 0,000295
CPU 5 DPC count: 37
_________________________________________________________________________________________________________
CPU 6 Interrupt cycle time (s): 0,177238
CPU 6 ISR highest execution time (µs): 8,586570
CPU 6 ISR total execution time (s): 0,000039
CPU 6 ISR count: 52
CPU 6 DPC highest execution time (µs): 46,184665
CPU 6 DPC total execution time (s): 0,003421
CPU 6 DPC count: 305
_________________________________________________________________________________________________________
CPU 7 Interrupt cycle time (s): 0,200464
CPU 7 ISR highest execution time (µs): 1,411175
CPU 7 ISR total execution time (s): 0,000032
CPU 7 ISR count: 42
CPU 7 DPC highest execution time (µs): 54,337760
CPU 7 DPC total execution time (s): 0,001566
CPU 7 DPC count: 146
_________________________________________________________________________________________________________
May be someone can make some sense out of this.
-
- KVRAF
- 2604 posts since 15 Jun, 2006
Where do you go to make sure virtual cores are turned on?BBFG# wrote: Fri Mar 21, 2025 5:09 pm Windows update is the problem. First, turn that off. Second, Disable Telemetry Compatibility. Third, turn off Defender.
And when you start your DAW, first open Task manager as these two will still try to run under some other trigger and End Task from there. Then give it a couple of minutes and it should go back to something close to normal. If you search these under their names with CPU usage, you'll see they are known issues that MS seemingly has incorporated on purpose. And they've incorporated something to turn them back on so you have to keep an eye on them.
Add/edit: there's also the Anti-malware Service Executable from within Defender that needs to have it's settings changed and where you can add exclusions for your DAW folder and plugin extensions and apparently even for itself. This helps to reduce CPU use too.
Also note that on my system, update has turned off virtual cores and only recognizes physical core now. And there are articles stating they don't believe multithreading is really necessary most of the time and actively tries to keep many things on a single core.
I call all of these things their poison pill market scheme. Trying to convince everyone their machine is just too old and that the user having control is the problem.
-
- KVRAF
- 9106 posts since 28 Apr, 2013
You can take these steps, however, MS has obsfucated this and effectively keeps you from turning them back on now. It still works to enable all cores (virtual/physical) under Win 7, 8, 8.1 and earlier versions of 10. But now it forces to use whether you demand physical cores or let Windows do it automatically. I've been hoping someone will eventually post which update made these changes so we can uninstall it and get these functions back.bill45 wrote: Mon Mar 24, 2025 5:05 pmWhere do you go to make sure virtual cores are turned on?BBFG# wrote: Fri Mar 21, 2025 5:09 pm Windows update is the problem. First, turn that off. Second, Disable Telemetry Compatibility. Third, turn off Defender.
And when you start your DAW, first open Task manager as these two will still try to run under some other trigger and End Task from there. Then give it a couple of minutes and it should go back to something close to normal. If you search these under their names with CPU usage, you'll see they are known issues that MS seemingly has incorporated on purpose. And they've incorporated something to turn them back on so you have to keep an eye on them.
Add/edit: there's also the Anti-malware Service Executable from within Defender that needs to have it's settings changed and where you can add exclusions for your DAW folder and plugin extensions and apparently even for itself. This helps to reduce CPU use too.
Also note that on my system, update has turned off virtual cores and only recognizes physical core now. And there are articles stating they don't believe multithreading is really necessary most of the time and actively tries to keep many things on a single core.
I call all of these things their poison pill market scheme. Trying to convince everyone their machine is just too old and that the user having control is the problem.
In answer to your question, I'm still trying to find out.BIOS Settings: Ensure that Hyper-Threading is enabled in your system’s BIOS settings. The exact steps may vary depending on your motherboard and BIOS version. Typically, you’ll need to:
Restart your computer and enter the BIOS setup (usually by pressing F2, F12, or Del).
Navigate to the “Advanced” or “CPU” tab.
Look for the “Hyper-Threading” or “CPU Core Control” option and set it to “Enabled”.
Save changes and exit the BIOS setup.
Windows Settings: After enabling Hyper-Threading in the BIOS, you need to configure Windows to use all available logical cores. You can do this:
Press the Windows key + R to open the Run dialog.
Type “msconfig” and press Enter to open the System Configuration window.
Click on the “Boot” tab.
Click on the “Advanced Options” button.
Uncheck the “Number of processors” box to allow Windows to use all available logical cores.
Click “OK” to save changes.
Task Manager: Verify that Windows is using all logical cores:
Press the Ctrl + Shift + Esc keys to open Task Manager.
Click on the “Performance” tab.
Look for the “CPU” graph, which should show all logical cores being utilized.
Additional Tips
I'll add here that I'm finding "snaps", "crackles" and "pops" are not registering as any significant CPU use and currently believe this is MS forcing a single core use whenever it can get away with it. So the CPU may show a momentary 3% "spike" that's still well within normal parameters but somehow still overloads the audio.
-
- KVRian
- 500 posts since 3 Dec, 2021
I had this exact thing. Tried all the 'optimisations for audio' I could find. I'm not a computer expert or a Windows expert but I can follow a step by step guide. One day I made three changes I found on the webs. I turned off core parking in the registry. I increased the page file size on my second SSD. I'm turned off file indexing for all disks.
Haven't had the audio glitch problem since.
I can't recommend any of these as good or bad for your PC, or remember exactly how I did it (I followed a YouTube video for the core parking) but my problems are gone.
Haven't had the audio glitch problem since.
I can't recommend any of these as good or bad for your PC, or remember exactly how I did it (I followed a YouTube video for the core parking) but my problems are gone.