Emulating an analog hardware spectrum analyzer

DSP, Plugin and Host development discussion.
RELATED
PRODUCTS

Post

Summary:
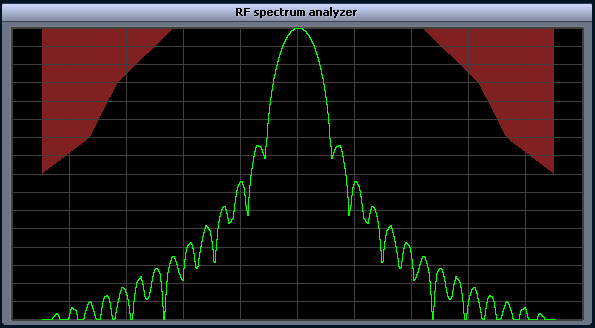
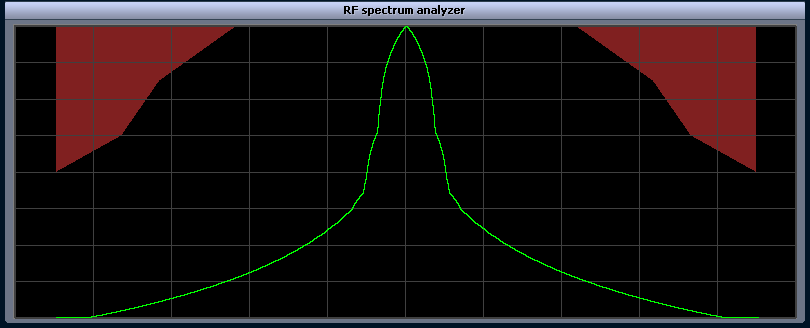
I need a way to do an FFT analysis of a (very short) piece of audio, which will give me the spectrum shown in the image and quote below. I'm currently using a Hann window (cosine), which gets close but the top is too wide - it needs to be sharper.

Full story:
I've been searching and trying things for several days now without luck, and I hope someone can help me.

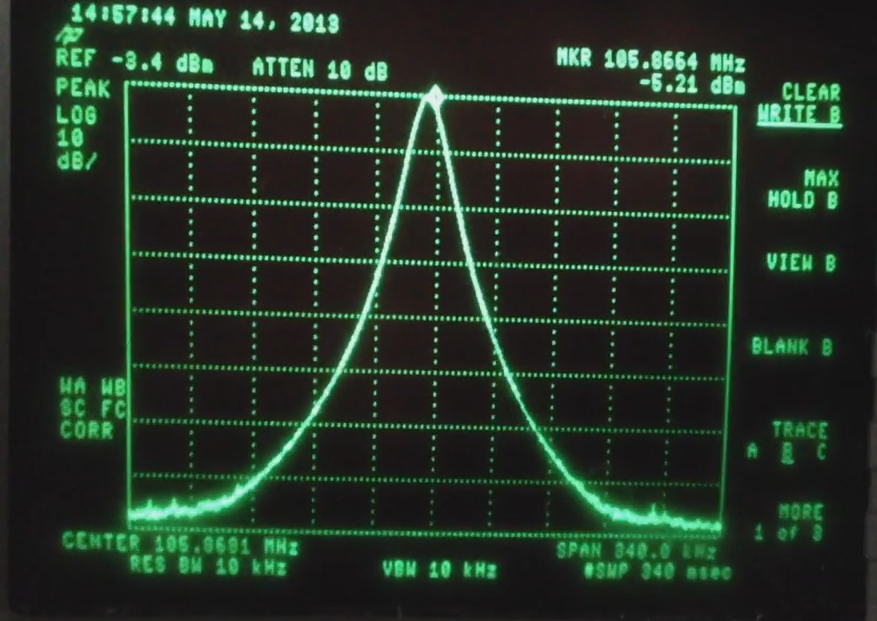
I make a VST plugin for FM radio stations, and in the Netherlands (and apparently nowhere else) there's an ITU recommendation that stations have to comply to: If you measure the FM signal with a spectrum analyzer with specific settings (most importantly Resolution Bandwidth RBW=10 kHz), there's a mask that may not be crossed. The standard is pretty old and it's based on analog spectrum analyzers.

These analog spectrum analyzers work by sweeping through the frequency range and measuring the peak level at each point. Because I need to make sure that my whole signal is compliant, I cannot use a sweep but I must analyse the whole spectrum, constantly.

I'm pretty close to implementing this, but there's one last "detail" that's extremely important for the measurements that I cannot get right: The filter shape.
RBW filters are generally Gaussian in shape, with shape factor (ratio of 60 dB bandwidth to 3 dB bandwidth) of 11:1 ratio.
Image

What I've done so far: FM-modulate the signal (this needs 16x oversampling to have enough room for all the side lobes) and analyse it using FFT's of very short pieces of signal using a Hann window (typically about 60 samples). I use FFT's to keep the CPU usage a bit under control - I need 16x oversampling! But a solution with a bandpass filter that gives the correct filter shape would also be welcome.

The result is close to what a real analog analyzer shows, except for one thing: The filter shape. The top is too wide. I can make the top less wide by increasing the number of samples in the window, but then the bottom isn't wide enough anymore.


In case anyone is interested, the ITU recommendation is ITU-R SM.1268, also known as the "Stokkemask": http://www.itu.int/dms_pubrec/itu-r/rec ... !PDF-E.pdf

Post

This is a screenshot of what I get using an FFT with Hann window. As you can see, except for the side lobes (which are at a relatively low level), the biggest difference is that the top in my image is much wider and in the real spectrum analyzer much sharper.

Image

At -10 dB, the spike must be 0.5 blocks wide, in my image it's almost 1 block wide.
At -20 dB, it should be 1 block wide - and it is!
At -40 dB, it should be 2 blocks wide - and it is! (if you smooth out the lines)
At -60 dB, it should be 4 blocks wide - and it is!

So the biggest difference compared to the real spectrum analyzer is in the top.

Post

If I recall it correctly, using a gaussian window function for the FFT should give you a gaussian filter shape. Have you tried that?

Post

AARCH! I wanted to post that that didn't work, and I was posting the Gaussian window function that I used here, and looked again at the Wikipedia page with the formula, and I seem to have forgotton a ^2!

With that it looks a lot better, still not the same shape at the bottom but that should be easier to fix.

Thanks a lot!

Post

hvz wrote: With that it looks a lot better, still not the same shape at the bottom but that should be easier to fix.
If you mean the side lobes by that, they come from the limited frame length you are using. Actually a real gaussian window is infinitely long. In practice, you have a combination of the gaussian window and a rectangular one. If you pick a longer framelength while retaining the window shape (thus extending the bell curve, not stretching it) the sidelobes will start to appear farther away from the center.

Post

I know, and I might roll off the edges to make it better (although the slopes are so steep that rolling them off might actually make it worse). But what I meant was the steepness (probably caused by window size etc.) - nothing that should be hard to fix. Side lobes are actually gone (at least below the visible range) with the Gaussian window - although they might come back again when I adjust the steepness.

Post

Yeah, Gaussian windows won't help anything if you need a finite window. The typical window functions approximate Gaussians anyway.

Whatever method you use, increasing frequency-domain resolution always means considering longer time-domain signal. This isn't specific to FFT and applies to a sweeping analog filter too (the faster the sweep, the wider the peak). The FFT specific trade-off with window functions then simply allows you to trade-off side-slope attenuation with some additional loss of frequency resolution. Unfortunately this trade-off comes on top of the fundamental time/frequency trade-off. If you need more resolution, there's no way around increasing the window length.

As far as your application goes, I'd suggest to design for a conservative estimate: decide between "valid", "unsure" and "invalid" which will let you treat "unsure" as invalid when trying to avoid violations, and valid when trying to detect them. Your problem then becomes a matter of minimizing the "unsure" region; observe that flagging everything as "unsure" is still a conservative estimate.. just not a very good one.

So if you have a specification of what is acceptable, fit once with the specification as an upper bound, and once with the specification as lower bound. Then whenever the two analyzers disagree on a given signal you treat it conservatively; the close the fits, the less often this happens.

Post

Also.. I'm pretty sure most places have some form of over-modulation regulation, though the specifics may vary.

Post

hvz wrote:[...] in the Netherlands (and apparently nowhere else) there's an ITU recommendation that stations have to comply to: If you measure the FM signal with a spectrum analyzer with specific settings (most importantly Resolution Bandwidth RBW=10 kHz), there's a mask that may not be crossed. The standard is pretty old and it's based on analog spectrum analyzers.

[...]

In case anyone is interested, the ITU recommendation is ITU-R SM.1268, also known as the "Stokkemask": http://www.itu.int/dms_pubrec/itu-r/rec ... !PDF-E.pdf
I'm actually somewhat interested in the legal side of this. I should have known about this when I was working as a regulatory policy officer for telecoms / media in the Dutch government - given that this requirement would only apply in the Netherlands, I probably would have proposed to get rid of it. Do you also happen to know the specific legal instrument in Dutch media law for making this recommendation mandatory? (Don't bother searching for if you don't.)

Post

@mystran: I know, I need a very small (in width) FFT window because I need to be able to detect short spikes - the only way to do that is to have extremely short windows.

Yes, there are other modulation limits set, which I have already implemented in my software (the normal '75 kHz' swing limit, ITU-R.BS412 for the German/Austrian/Hungarian market).

This specific one comes on top of the 75 kHz limitation; a station should comply to both. As far as I know, almost no-one ever looks at it (you need a spectrum analyzer for it and most stations don't have one, especially the smaller stations). And I've heard from people that as long as there are no complaints, the regulatory agencies won't look at it either. In fact, there are several stations that exceed the 75 kHz limitation a bit - if you exceed that you *definitely* exceed the Stokkemask, and the overshoots will be big (if you look at the mask in my screenshot above, having a louder peak level will make your whole signal be wider in horizontal direction AND higher in vertical direction, which easily causes huge Stokkemask overshoots).

@Ch00rD: I've seen it being mentioned in the licensing documents of radio stations. And actually it makes more sense than many other regulations that are used elsewhere - basically what it does is it forces stations to lower signals that are in the range of the next station on the band. Given how crowded the Dutch FM band is, that might be a good idea. What makes it difficult for me when trying to implement something is that the whole specification is based on settings used on a spectrum analyzer instead of things like "at frequency X you may not send out a louder signal than Y". That would be harder to measure using an analyzer but it would make things a lot easier.

I should also add that, given the way the analysis works (sweeps are done, and a smoothing filter is used over the end result), it seems - based on some initial tests that someone who has an analyzer did for me - that even without performing any extra filtering the test as described in the ITU document almost (warning: almost!) always passes, even if you don't do anything to protect against overshoots - short overshoots will be filtered out (the output of the sweep measurement is also smoothed) and longer ones are rare, and because you're sweeping you'll miss most of them anyway.

If you listen to the big commercial Dutch stations, you'll notice that there's little stereo separation. That reduces the high frequencies in the MPX signal and that in turn makes the signal more compact in horizontal direction - which is probably how the big stations avoid (most?) Stokkemask overshoots.

Post

Image

I'm getting closer - the width is not yet correct (should be about twice as wide, fixable), the worst thing is though that the part on top doesn't have the exact shape it should have yet - it's still a bit too wide, no idea why. It's a lot closer than what I had before though.

Edit: Ah, I see I'm using a 2^7 FFT (128 values, or 64 frequency bands). Of course 64 bands isn't enough for a high precision display, so probably both the differences in shape and the sometimes slightly abrupt direction changes are caused by this.

Post

hvz wrote:@mystran: I know, I need a very small (in width) FFT window because I need to be able to detect short spikes - the only way to do that is to have extremely short windows.

Yes, there are other modulation limits set, which I have already implemented in my software (the normal '75 kHz' swing limit, ITU-R.BS412 for the German/Austrian/Hungarian market).
Oh, I see. So this particular one is just particularly ill-specified. Sorry about my ignorance. Also.. the link you posted doesn't seem to work, so can't look at the details (and yeah, too lazy to search).
What makes it difficult for me when trying to implement something is that the whole specification is based on settings used on a spectrum analyzer instead of things like "at frequency X you may not send out a louder signal than Y". That would be harder to measure using an analyzer but it would make things a lot easier.
So the specification says that a sweeping analyzer must not detect signals outside a given specification, but the specification itself can be exceeded as long as the analyzer won't report problems? Did I get it right now? If that's the case.. then yeah it sounds totally retarded.

I don't see how you're going to match such an analyzer with a short window FFT though. An analog analyzer is minimum-phase and in theory the sweeping makes it time-variant as well. Assuming the sweep is relatively slow though (so as to have negligible effect on the analysis.. which I'd imagine is the case) then what you could do is sample the IR of the analysis filter for a set of snapshots from the sweep, then run FFT correlation against each one of them. Not exactly too nice computationally, but at least you can use long FFTs to push down the asymptotic complexity (assuming you can take the latency).
I should also add that, given the way the analysis works (sweeps are done, and a smoothing filter is used over the end result), it seems - based on some initial tests that someone who has an analyzer did for me - that even without performing any extra filtering the test as described in the ITU document almost (warning: almost!) always passes, even if you don't do anything to protect against overshoots - short overshoots will be filtered out (the output of the sweep measurement is also smoothed) and longer ones are rare, and because you're sweeping you'll miss most of them anyway.
This is obvious. The data of such a sweeping analyzer will necessarily depend on the timing of the sweep with respect to the signal. As such, the only way to be sure (that no such timing will detect overshoots), is to either conservatively estimate what the analyzer might be able to detect (which will probably end up being conservative enough that everyone will simply ignore it) or to run the sweep for all possible timing offsets (which means simply having an analog analyzer won't actually help you at all.. but the FFT correlation trick above might make it feasible.. though it still might be more cost-efficient to just take the gamble).

Honestly, this piece of regulation sounds like it makes most EU directives about strawberries suddenly look remarkably sensible.

Post

This forum doesn't seem to be able to handle some characters in the URL, here's a page with a link to the document:
http://www.itu.int/rec/R-REC-SM.1268-2-201102-I/en

The relevant part is this:
4 Adjustments of the spectrum analyzer
The spectrum analyzer should be adjusted as follows:
- centre frequency (CF) = f0 (carrier frequency of the transmitter);
- RBW 10 kHz (IF filter);
- VBW 10 kHz (video filter);
- span: 340 kHz;
- sweeptime: 340 ms (1 ms/kHz);
- max hold mode;
- input attenuation is dependent on input level.
Settings for digital signal processor (DSP) analyzers will be different but should provide equivalent results.
You have to do this 3 times for 5 minutes each, while broadcasting 'representative programme material for that particular transmitter'.


Oddly, I see that I found a newer version of this specification than the one I used before, there's a new Annex 2 part in it - I'm not yet really sure what the connection between the two is.

BTW: You can ignore the whole 'modulation power' thing, that's NOT mandatory in the Netherlands (but it is in Germany, Austria, Switzerland and Hungary, I think that's more or less the complete list).

Post

http://rf-test.tm.agilent.com/2013/01/s ... l-filters/

O well, THAT explains a lot:
"The shape is called Gaussian, though it's only the very middle/top of the passband that's especially Gaussian in shape. The skirts of the filter make it look rather more triangular overall." :shock:

Post

This is a very old topic but I want to respond because I am also implementing stokkemask metering on my MPX analyzer.

The shape of the window that should be used is not a standard window such as Hamming, Hanning, Triangular or Gaussian.
The shape that you see on a analog spectrum analyzer is determined by the Q factor of the local oscillator of the spectrum analyzer, the response of the VBW filter and the RBW setting. So I think the window filter should be modelled by these factors.

Post Reply

Return to “DSP and Plugin Development”