

I'm in need of visualizing some various biquad filters and have a semi-working script to draw the frequency response. The issue I'm running into is that it doesn't look like the filter visualizations you would find in Serum's filters or pretty much any plugin with filter visualization. I'm just taking a given magnitude at a frequency from the biquad transfer function and using complex numbers in C++. This filter shown is the standard biquad lowpass filter.
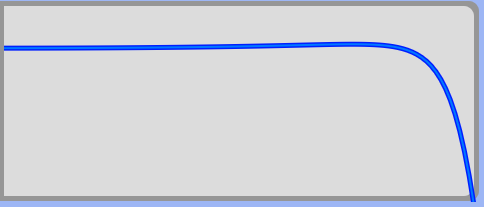
It works well in some cases at higher cutoffs:
But at lower cutoffs it ends up going past a magnitude of 1 in some parts of the frequency domain:

On changing the cutoff, the filter warps a lot too. What are people doing differently to get clean results?